Generator node
EEG Spectrum
Plots EEG power spectral density per electrode — frequency in Hz on the X axis, power in µV² (or dB) on the Y axis — as bars, a smooth spline line, or a filled curve. It reads the Spectrum JSON produced by FFT EEG, colors each electrode by hue, shades the classic Delta/Theta/Alpha/Beta/Gamma zones behind the plot, and hands back Peak Frequencies and Bands JSON so downstream nodes can react to what the plot shows. Use it whenever you need a readable, labelled frequency view of live brain data.
Inputs
| Port | Type | Default |
|---|---|---|
| EnableTurns the plot off without removing it. Off leaves an empty frame rather than freezing the last spectrum. | bool | true |
| SpectrumThe power spectrum to draw — cable it from the Spectrum output of FFT EEG, which carries one power array per electrode. With nothing connected the plot stays empty. | json | — |
| XHorizontal centre of the plot in Grafit units, 0 being screen centre. Not clamped; past the viewport edge the plot simply leaves the frame. | float | 0 |
| YVertical centre of the plot in Grafit units. Not clamped, so it can be parked off screen. | float | 0 |
| WidthWidth of the plot area in Grafit units. Not clamped; 2 spans the short edge of the viewport, which is the usual full-width setting. | float | 2.0 |
| HeightHeight of the plot area in Grafit units. Not clamped; 0.5 is a comfortable strip, 2 fills the short edge. | float | 0.5 |
| Freq MinLeft edge of the frequency axis, in Hz. If it reaches or passes Freq Max it is pushed back to one Hz below it, so the axis never collapses. | float | 0.5 |
| Freq MaxRight edge of the frequency axis, in Hz. Zero or negative snaps back to 45 Hz; EEG rarely rewards going past about 90. | float | 90.0 |
| Power MaxCeiling of the power axis in µV². Leave it at 0 for auto-scale, which tracks the strongest bin with a little headroom; any positive value locks the ceiling there. | float | 500.0 |
| Show GridDraws the frequency and power gridlines with their numbers behind the curves. | bool | true |
| Show LabelDraws the electrode names and the axis numbers. | bool | true |
| Label SizeText size of those labels, in points. Values under 1 are lifted to 1; roughly 10…20 stays readable at normal plot sizes. | float | 12.0 |
| Line ThicknessMultiplies the width of the curves and bars. Values under 0.1 are lifted to 0.1; not capped above, but past about 4 neighbouring lines merge. | float | 1.0 |
Outputs
| Port | Type |
|---|---|
| Image | image |
| WidthWidth of the plot area in Grafit units. Not clamped; 2 spans the short edge of the viewport, which is the usual full-width setting. | float |
| HeightHeight of the plot area in Grafit units. Not clamped; 0.5 is a comfortable strip, 2 fills the short edge. | float |
| Peak Frequencies | json |
| Bands | json |
Screenshots
Live Preview
How It Works
CPU side (per frame). The node resolves the Spectrum JSON, sorts electrode keys into anatomical front-to-back order (Fp, F, C, P, T, O — handling A_/B_/C_ prefixes), and reads the frequency resolution from the FFT EEG payload (_freqRes, falling back to a cached value or 0.244 Hz). It converts Freq Min/Freq Max into a visible bin window, clamps each PSD slice to [0, 1e6], and applies exponential smoothing with vDSP: smoothed = smoothed × α + new × (1 − α), where α is the Settings-panel Smoothing value. The smoothed bins for all electrodes are packed into one reusable shared-storage MTLBuffer. In Single mode, only the selected electrode's slice is uploaded.
Auto-scaling. If Power Max is greater than 0 it is used directly. If it is 0 or negative, the node auto-scales: an EMA tracker follows the global maximum bin with 20% headroom (autoMax = autoMax × 0.95 + globalMax × 1.2 × 0.05), floored at 0.001. This is what lets a plot stay readable as signal strength changes.
GPU side. A fullscreen quad over the plot area draws band zones, grid, and — in Line/Filled style — the spectrum itself, evaluated as a Catmull-Rom spline (4 subdivisions per bin, 3 bin spans searched) against a point-to-segment SDF for gap-free, aspect-corrected anti-aliased curves. In Bars style a second instanced pass draws one quad per bin per electrode (80% fill, 20% gap). Output is premultiplied alpha; edge softness comes from Grafit's global AA multiplier.
Coordinates and outputs. X/Y position the plot's center in Grafit coordinates (origin at viewport center, shorter viewport edge maps to [-1, 1]); Width/Height set its extent. With labels enabled a 12% left margin and 8% right margin are reserved, and traces render only in between. The Image output feeds a Canvas node — nothing appears on screen without one — and setting Enable to false clears the texture.
Power scale
| Scale | Value | Normalization | Left-ruler unit |
|---|---|---|---|
| Linear | 0 (default) | psd / powerMax, clamped to [0, 1] | µV² |
| Logarithmic (dB) | 1 | 10·log10(psd) mapped from −20 dB up to 10·log10(powerMax) | dB |
Display modes (Settings panel)
| Mode | Value | Layout |
|---|---|---|
| Stacked | 0 | Each electrode gets its own horizontal strip; divider lines separate strips, and the left labels show 0 and the power ceiling for the bottom strip |
| Overlay | 1 (default) | All electrodes share the full plot height, drawn at reduced alpha (0.6 for bars, 0.7 for lines) so overlaps stay readable; the left side becomes a nice-step ruler |
| Single | 2 | Only the electrode chosen in the Electrode picker is uploaded and drawn, at full height, keeping its color from the full electrode set |
Render styles (Settings panel)
| Style | Value | Appearance |
|---|---|---|
| Bars | 0 | One instanced quad per frequency bin per electrode, 80% bin width |
| Line | 1 (default) | Catmull-Rom spline through the bins, SDF anti-aliased, thickness scaled by Line Thickness |
| Filled | 2 | The same spline with the area beneath it shaded at 25% of the trace alpha |
Band zones
Band ranges are not hardcoded — they come from the _bandRanges payload attached by FFT EEG, so whatever bands you configure upstream are what get drawn. The first five are shaded as background zones at 8% alpha, and a colored boundary line marks each band's lower edge (the first band's edge is skipped). Colors are fixed per band name:
| Band | Zone color |
|---|---|
| Delta | red |
| Theta | orange |
| Alpha | green |
| Beta | blue |
| Gamma | violet |
| Mu | teal |
| Custom | gray |
Grid and labels
Frequency grid lines use a nice-number step (…0.1, 0.2, 0.5, 1, 2, 5, 10…) targeting about 8 minor divisions across the range, with major lines at 5× the minor step; horizontal power lines are fixed at 0, 25, 50, 75, 100% of the plot height. Labels are AppKit text overlays: a left-side power ruler (up to 12 ticks), right-side electrode legends colored by hue, a unit indicator above the plot (µV² or dB), and frequency labels beneath every grid line (up to 50), with major-line labels drawn brighter.
Data outputs
- Peak Frequencies — per electrode, a nested object with
peakFreq(Hz of the strongest visible bin) andpeakPower. Note the plural key name and the nested structure; both the outer object and the band object are ordered anatomically. - Bands — per electrode, the mean power inside each configured band, keyed by band name in the order FFT EEG supplied.
- Width / Height — pass through the resolved
WidthandHeightinputs as floats, handy for aligning other generators to the same box.
Parameters in Depth
| Port | Type | Default | Meaning |
|---|---|---|---|
| Enable | Bool | true | Toggles rendering; false clears the texture |
| Spectrum | JSON | — | PSD per electrode from FFT EEG, including _freqRes and _bandRanges metadata |
| X | Float | 0 | Horizontal center of the plot, Grafit units |
| Y | Float | 0 | Vertical center of the plot, Grafit units |
| Width | Float | 2.0 | Plot width in Grafit units (2.0 spans the short viewport edge) |
| Height | Float | 0.5 | Total plot height; divided per electrode in Stacked mode |
| Freq Min | Float | 0.5 | Lower bound of the displayed frequency range, Hz |
| Freq Max | Float | 90.0 | Upper bound of the displayed frequency range, Hz |
| Power Max | Float | 500.0 | Y-axis ceiling in µV²; set to 0 to enable EMA auto-scaling with 20% headroom |
| Show Grid | Bool | true | Frequency/power grid, strip dividers, band boundary lines, and border |
| Show Label | Bool | true | Power ruler, electrode legends, unit indicator, frequency labels; also reserves the side margins |
| Label Size | Float | 12.0 | Base label size in points — electrode names at 100%, ruler values at 92%, unit and frequency labels at 83% |
| Line Thickness | Float | 1.0 | Multiplier on line/bar-mode trace width; clamped to a minimum of 0.1, with an fwidth-based floor so lines stay visible at small plot sizes |
Interactions worth knowing: Freq Min is forced below Freq Max (if you invert them the node repairs the range), and the frequency window together with the FFT's bin resolution determines visibleBins — a narrow window over a high-resolution FFT yields fat, well-separated bars, while a wide window makes Bars style dense enough that Line or Filled reads better. Power Max and the Power Scale setting jointly define the vertical mapping, and the left ruler always relabels itself to match. Smoothing (Settings) trades responsiveness for stability and applies before every other calculation, including the peak and band outputs.
Use Cases
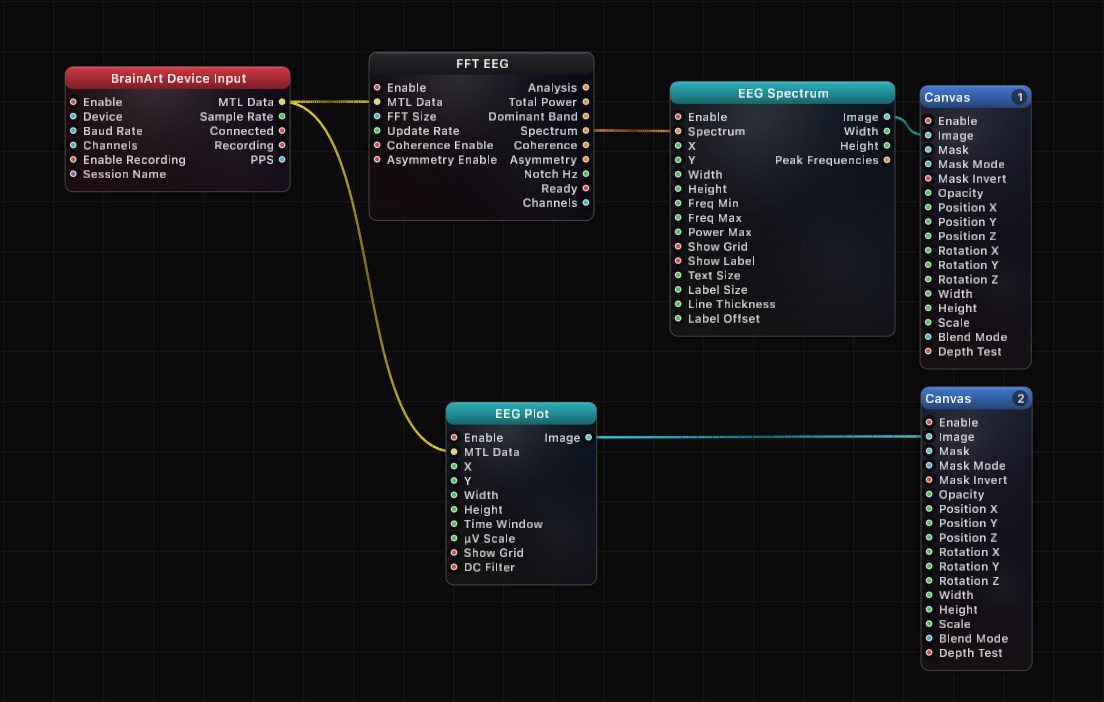
- BrainBrick Device Input → FFT EEG → EEG Spectrum → Canvas — the standard live PSD display for a neurofeedback session
- EEG Spectrum (
Bands) → JSON Array Get → Remap → Canvas Opacity — let alpha-band power fade a visual layer in and out - EEG Spectrum (
Peak Frequencies) → JSON Array Get → Remap — drive a color, rotation, or particle rate from each electrode's dominant frequency - EEG Spectrum in Stacked mode with a tall
Height— compare spectral profiles across all electrodes at a glance for montage checks - EEG Spectrum in Single mode with the Electrode picker — focus a large hero plot on one site (e.g. an occipital channel for alpha work)
- BrainBrick Device Input → EEG Plot → Canvas on one layer and EEG Spectrum → Canvas on another — a research dashboard showing time and frequency domains together
- EEG Spectrum (
Bands) → Smooth → threshold logic — trigger scene changes when a band crosses a level, using the same smoothed data the plot shows
Tips
- Generators are invisible without a Canvas node on
Image; Canvas owns layer order (Layer 1 = back) and blend mode. - Set
Power Maxto 0 whenever signal strength varies between sessions — auto-scaling keeps the plot readable without manual tuning. - Band zones and boundary lines mirror whatever ranges FFT EEG is configured with, so change the bands there, not here.
- Bars style at a wide frequency range renders one instance per bin per electrode; Line or Filled is both cheaper to read and usually cheaper to draw at high bin counts.
- Turn
Show Labeloff for production visuals — it also removes the side margins, letting the spectrum use the full plot width. - Anti-aliasing follows Grafit's global AA multiplier; there is no per-node AA quality control.
- Electrode keys are kept in anatomical front-to-back order (Fp, F, C, P, T, O) through ordered JSON, so
Peak FrequenciesandBandsiterate in the same order as the legend on screen.
A ready-made example project for this node is built into Grafit Pro: select the node in the library and open or drag the example from its description panel.
Open EEG Spectrum in the interactive catalog →
EEG Spectrum is one of 381 nodes in Grafit Pro.
Free download. Every feature for 7 days, no card. Then €99.99 once — or keep playing your projects as a Player.