Generator node
EEG Plot
Real-time multi-channel EEG waveform plotter with a rolling "chalkboard" sweep display, driven directly from a MTL Data ring buffer for zero-copy GPU rendering. Traces are decimated on the GPU with a min-max compute kernel, drawn as SDF anti-aliased lines with Catmull-Rom smoothing, and annotated with live per-channel value labels, electrode names, and time markers. Reach for it whenever you need a clinical-style live trace of raw biosignal data — plus a Values JSON output that mirrors exactly what you see on screen.
Inputs
| Port | Type | Default |
|---|---|---|
| EnableOff stops drawing the plot; the incoming data keeps flowing to other nodes. | bool | true |
| EEG DataThe live multi-channel EEG to plot: EEG Data from BrainBrick Device Input, or a Signal in µV (EEG Stream Receive, Signal Channels, a filter). The plot stays empty until samples arrive. | structure | — |
| XHorizontal centre of the plot in Grafit units, 0 being the middle of the view. | float | 0 |
| YVertical centre of the plot in Grafit units, 0 being the middle of the view. | float | 0 |
| WidthPlot width in Grafit units. 2 spans the short edge of the view. | float | 2.0 |
| HeightTotal plot height in Grafit units — the channels share it between them, so more channels means thinner slots. | float | 0.5 |
| Show LabelsDraws the electrode names, the level ticks and the time axis. | bool | true |
| Label SizeText size of those labels, in screen points. Around 12 matches the rest of the interface. | float | 12.0 |
| Time WindowHow many seconds of signal are visible at once. Not clamped; short windows sweep fast, very long ones thin the trace out. | float | 10.0 |
| µV ScaleVertical range of one channel slot, in microvolts — smaller zooms into the signal, larger flattens it. In Raw ADC mode this becomes RAW Scale and counts raw ADC units instead. | float | 120.0 |
| Show GridDraws the time and level grid behind the traces. | bool | true |
| DC FilterRemoves each channel's slow drift so its trace stays centred in its slot instead of wandering off screen. | bool | true |
Outputs
| Port | Type |
|---|---|
| Image | image |
| Values | json |
Screenshots
Live Preview
How It Works
Each frame, EEG Plot runs a two-stage GPU pipeline and then draws text overlays.
1. Compute (min-max decimation, "chalkboard" mode). The kernel eeg_plot_minmax reduces the raw ring buffer to one min/max pair per output pixel column per channel. Output width is the viewport width, capped at 4096 columns; samples per column are visibleFrames / outputWidth, where visibleFrames = sampleRate × Time Window (clamped to the buffer's maxFrames). Crucially, a column is computed once, when the sweep passes over it, and never recomputed — old data stays exactly where it was drawn, which is what produces the chart-recorder look. Only columns between the previous and current sweep position are updated each frame.
2. DC offset (incremental rolling mean). When DC Filter is on, eeg_plot_dc_incremental maintains a per-channel running sum over the visible window, adding new samples and subtracting expired ones — O(delta) work per frame rather than O(window). The resulting mean is subtracted from every sample before decimation, so baseline drift cannot push traces out of their lane. NaN and Inf samples are skipped.
3. Render. One instanced 6-vertex quad per displayed channel; the fragment shader reads the min/max buffer, applies optional smoothing by blending neighbouring columns, interpolates the centerline and the min-max envelope with a Catmull-Rom spline, and evaluates a signed-distance line. Values are normalized as value / scale clamped to ±0.45 of the channel slot, so a signal at exactly the scale limit fills the lane. Output is premultiplied alpha; anti-aliasing uses fwidth() scaled by Grafit's global AA multiplier.
Two automatic visual cues are baked into the shader:
| Cue | Trigger | Appearance |
|---|---|---|
| Clipping indicator | Envelope exceeds 90% of the scale | Trace tints toward red |
| Muscle artifact glow | Envelope range exceeds 60% of the scale | Trace brightens |
An eraser bar — a soft gap roughly 1.5% of the plot width — travels with the write head, separating the newest data from the oldest.
Coordinates and outputs
X/Y place the plot's center in Grafit coordinates (origin at viewport center, shorter viewport edge maps to [-1, 1]); Width/Height are the plot's extent. When labels are enabled the shader reserves a 12% left margin and an 8% right margin, so traces are drawn only in the middle band. Like every generator, EEG Plot renders to an offscreen MTLTexture that becomes visible only through a Canvas node, and setting Enable to false clears that texture.
Besides Image, the node emits a Values JSON output: the latest per-electrode value after the same notch-average and DC subtraction the display uses, converted to µV when in µV mode. Keys are the electrode labels supplied by the data source and are wrapped in ordered JSON so anatomical front-to-back order (Fp, F, C, P, T, O) is preserved.
Display modes (Settings panel)
| Mode | Value | Layout |
|---|---|---|
| Stacked | 0 (default) | Each channel gets its own horizontal lane, split evenly over Height; grid draws separators plus a zero baseline per lane |
| Overlay | 1 | All channels share the full height; the left margin becomes a nice-step value ruler and horizontal grid lines match its ticks |
| Single | 2 | Only the electrode chosen in the Electrode picker is drawn, at full height |
Style, smoothing, filters (Settings panel)
| Setting | Values | Effect |
|---|---|---|
| Style | Line (0, default), Filled (1) | Filled shades the area between the trace and the lane baseline at 35% alpha, keeping the line on top |
| Smoothing | 0–95%, 5% steps (default 0%) | Blends neighbouring decimation columns before spline interpolation — visual only |
| Notch Filter | On (default) / Off | Cycle-average comb filter that cancels powerline hum and its harmonics; window = sampleRate / frequency samples, symmetric and zero-phase. Visual only — recorded raw data is unchanged |
| Frequency | 50 Hz (default) / 60 Hz | Powerline frequency for the notch filter |
| Values | Raw ADC (0) / µV (1, default) | Unit mode; also renames the scale port |
| PGA Gain | 1x, 2x, 4x, 6x, 8x, 12x, 24x (default 24x) | ADS1299 amplifier gain used in the µV conversion |
| VREF (V) | 0.1–5.0, default 4.5 | Reference voltage used in the µV conversion |
The µV conversion is µV per count = (VREF × 1,000,000) / (2²³ × Gain), i.e. 4.5 V at 24x yields about 0.02235 µV per ADC count. The inspector shows the computed value live.
Dynamic scale port
The amplitude port renames itself with the unit mode: it is µV Scale (default 120.0) in µV mode and RAW Scale (default 500.0) in Raw ADC mode. Each mode's value is remembered separately, so switching back and forth never carries a raw-count scale into microvolts. Connections survive the rename.
Parameters in Depth
| Port | Type | Default | Meaning |
|---|---|---|---|
| Enable | Bool | true | Toggles rendering; false clears the texture |
| MTL Data | Structure | — | Zero-copy ring-buffer bundle (buffer, channel count, sample rate, write head, frame capacity, electrode labels) from BrainBrick Device Input |
| X | Float | 0 | Horizontal center of the plot, Grafit units |
| Y | Float | 0 | Vertical center of the plot, Grafit units |
| Width | Float | 2.0 | Plot width in Grafit units (2.0 spans the short viewport edge) |
| Height | Float | 0.5 | Total plot height; in Stacked mode this is divided by the channel count |
| Show Labels | Bool | true | Draws value labels, electrode legends, the unit indicator, and second markers; also reserves the side margins |
| Label Size | Float | 12.0 | Base label size in points — electrode names at 100%, values at 92%, unit/time markers at 83% |
| Time Window | Float | 10.0 | Seconds of data across the plot; also sets vertical grid spacing (one line per second) |
| µV Scale / RAW Scale | Float | 120.0 / 500.0 | Full-scale amplitude per lane; the plot displays roughly ±this value |
| Show Grid | Bool | true | Time grid, lane separators or ruler lines, border, and eraser highlight |
| DC Filter | Bool | true | Subtracts the rolling per-channel mean from every displayed sample |
Interactions worth knowing: Time Window and viewport width jointly set samplesPerPixel — a long window on a narrow viewport means more samples collapsed per column, so the min-max envelope grows thicker while the centerline stays smooth. Height divided by channel count sets the lane height in Stacked mode, and the minimum line thickness is expressed relative to that lane, so very short plots with many channels render proportionally chunkier traces. Label Size only matters when Show Labels is on; turning labels off also removes the margins, giving traces the full width.
Use Cases
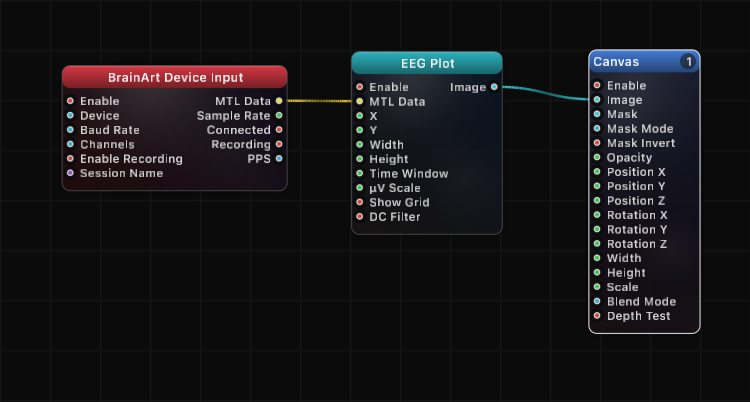
- BrainBrick Device Input → EEG Plot → Canvas — the standard live 8-channel monitor with lanes, values, and time markers
- BrainBrick Device Input → EEG Plot with Overlay mode — superimpose all electrodes on one ruler to spot channels that diverge
- EEG Plot (
Values) → JSON Array Get → Remap → Canvas position — drive visuals from the same filtered per-electrode value that the trace displays - BrainBrick Device Input → FFT EEG → EEG Spectrum → Canvas, alongside an EEG Plot on a second Canvas layer — time domain and frequency domain side by side
- EEG Plot in Single mode with a large µV Scale on a projection layer — a single dramatic hero trace for a performance
- EEG Plot (
Values) → Smooth → Array/Math chain — condition the live per-electrode readout before triggering events
Tips
- Nothing renders without a Canvas node on the
Imageoutput; Canvas also owns layer order and blend mode. - Connect
MTL Datastraight from BrainBrick Device Input — the buffer is shared unified memory, so no per-frame copy happens on the CPU. - If traces look flat, the scale is too large; if they clip red, it is too small. Red tinting starts at 90% of full scale by design.
- Keep DC Filter enabled for electrode recordings: without it, slow baseline wander drags traces out of their lanes within seconds.
- The notch filter and DC filter are display-only. Anything you record via the recording nodes still contains the untouched raw signal.
- A hard reset (clearing all buffers and redrawing) is triggered automatically when the data buffer pointer changes, when a cable is reconnected, or when the write head jumps more than a full sweep — so unplugging and replugging a device does not corrupt the sweep.
- Anti-aliasing follows Grafit's global AA multiplier; there is no per-node AA quality control.
A ready-made example project for this node is built into Grafit Pro: select the node in the library and open or drag the example from its description panel.
Open EEG Plot in the interactive catalog →
EEG Plot is one of 381 nodes in Grafit Pro.
Free download. Every feature for 7 days, no card. Then €99.99 once — or keep playing your projects as a Player.